---
title: "Categorizing Pitches in Baseball"
format:
revealjs:
theme: [default, custom.scss]
logo: img/icon.png
footer: "Christopher Teixeira"
width: 1350
code-fold: false
disable-layout: false
self-contained: true
incremental: false
# pptx:
# logo: img/icon.png
# footer: "Christopher Teixeira"
# incremental: false
editor_options:
chunk_output_type: console
---
## Introduction to the problem {visibility="hidden"}
{{< video img/video.mp4 height="550" >}}
Source: [MLB on Youtube](https://www.youtube.com/watch?v=0DFYJkneoMo)
## {background-video="img/video.mp4"}
## How is pitch type detected today?
There are three key features of every pitch to watch for:
::: {.incremental}
1. **Velocity** - the speed of the pitch
2. **Movement** - the general movement of the pitch
3. **Break** - the shift in direction
:::
. . .
...and by asking the pitcher what types he throws.
Source: [Baseball pitches illustrated by Lokesh Dhakar](https://lokeshdhakar.com/baseball-pitches-illustrated/)
## What types of pitches are there? {.smaller}
:::: {.columns}
::: {.column .subtitle .nonincremental width="33%"}
#### Fastballs
Four-seam
Two-seam
Cutter
Sinker
{fig-align="center" fig-alt="Four-seam fastball path"}
:::
::: {.column .subtitle .nonincremental width="34%"}
#### Breaking balls
Curveball
Slider
Slurve
Screwball
{fig-align="center" fig-alt="Curveball breaking ball path"}
:::
::: {.column .subtitle .nonincremental width="33%"}
#### Offspeed
Changeup
Palmball
Circle change
Splitter
{fig-align="center" fig-alt="Changeup offspeed pitch path"}
:::
::::
There's another couple of pitches that don't quite fall into any of those categories: eephus, knuckle, fork, gyro.
Source: [Baseball pitches illustrated by Lokesh Dhakar](https://lokeshdhakar.com/baseball-pitches-illustrated/)
## Set up code {.smaller visibility="hidden"}
```{r setup}
#| label: read in data
library(tidyverse)
library(ggthemes)
library(tidymodels)
library(tidyclust)
set.seed(42)
pitchtypes.raw <- "*CH - Changeup - Offspeed\n*CU - Curveball - Breaking\n*FA - Fastball - Fastball\n*FT - Two Seamer - Fastball\n*FF - Four Seamer - Fastball\n*FC - Cutter - Fastball\n*SL - Slider - Breaking\n*FS - Splitter - Offspeed\n*SI - Sinker - Fastball\n*FO - Forkball - Other\n*KN - Knuckleball - Other\n*KC - Knuckle Curve - Breaking\n*SC - Screwball - Breaking\n*GY - Gyroball - Other\n*EP - Eephus - Other\n*PO - Pitchout - Other\n*IN - Intentional Ball - Other\n*AB - Automatic Ball - Other\n*AS - Automatic Strike - Other\n*UN - Unknown - Other" %>%
str_match_all("(\\w{2}) - (\\w+\\s?\\w+) - (\\w+)")
pitchtypes <- pitchtypes.raw[[1]] %>% as_tibble() %>% select(pitchType=V2,pitch=V3,category=V4)
data.2013 <- read_csv("../data/2013.csv")
data.2014 <- read_csv("../data/2014.csv")
data.2015 <- read_csv("../data/2015.csv")
data.all <- bind_rows(data.2013,data.2014,data.2015)
```
## A quick look at data {.smaller visibility="hidden"}
```{r glimpse_data}
#| label: skim data
#| eval: false
data.all |>
select(pitcherId,pitchType,releaseVelocity,spinRate,spinDir,px,pz,szt,szb,x0,y0,z0,vx0,vy0,vz0,ax,ay,az) |>
mutate(pitchType=factor(pitchType)) |>
# skimr::skim()
glimpse()
```
## How many pitch types exist? {.smaller}
```{r pitch_distribution}
#| label: glimpse data
#| fig-align: center
#| fig-alt: "Distribution of pitch types in data"
#| echo: true
#| code-fold: true
pitch.types.df <- data.all |>
left_join(pitchtypes) |>
mutate(pitch=factor(pitch)) |>
group_by(pitch,category) |>
count() |>
arrange(desc(n))
pitch.types.df |>
ggplot(aes(x=reorder(pitch,-n),y=n)) +
geom_bar(stat="identity",fill="#999999") +
geom_text(aes(label=pitch,y=0),angle=90,nudge_y = 5000,hjust=0)+
labs(x="Pitch Type",
y="Number of Pitches") +
scale_y_continuous(labels=scales::label_comma()) +
ggthemes::theme_hc() +
theme(axis.ticks.x = element_blank(),
axis.text.x = element_blank())
```
## What data do we have to work with? {.smaller .nonincremental}
```{r clean_data}
#| label: filter data
pitch.data <- data.all |>
select(pitcherId,pitchType,releaseVelocity,spinRate,spinDir,px,pz,x0,z0,vx0,vy0,vz0,ax,ay,az) |>
left_join(pitchtypes) |>
tidyr::drop_na()
```
Variables that I use from the dataset:
::: {.fragment .highlight-current-blue}
- Pitcher ID (_pitcherId_)
- Pitch type (_pitchType_, _pitch_, _category_)
:::
::: {.fragment .highlight-current-blue}
- Release velocity (_releaseVelocity_)
- Velocity along the X axis of the field at the first measurement (_vx0_, _vy0_, _vz0_)
- Acceleration of the ball (_ax_, _ay_, _az_)
- Spin rate (_spinRate_)
- Spin direction (_spinDir_)
:::
::: {.fragment .highlight-current-blue}
- Distance from the horizontal center of the plate as the ball crosses the front plane of the plate (_px_)
- Height above the ground as the ball crosses the front plane of the plate (_pz_)
- Distance from the center of the plate at the first measurement (_x0_, _y0_, _z0_)
:::
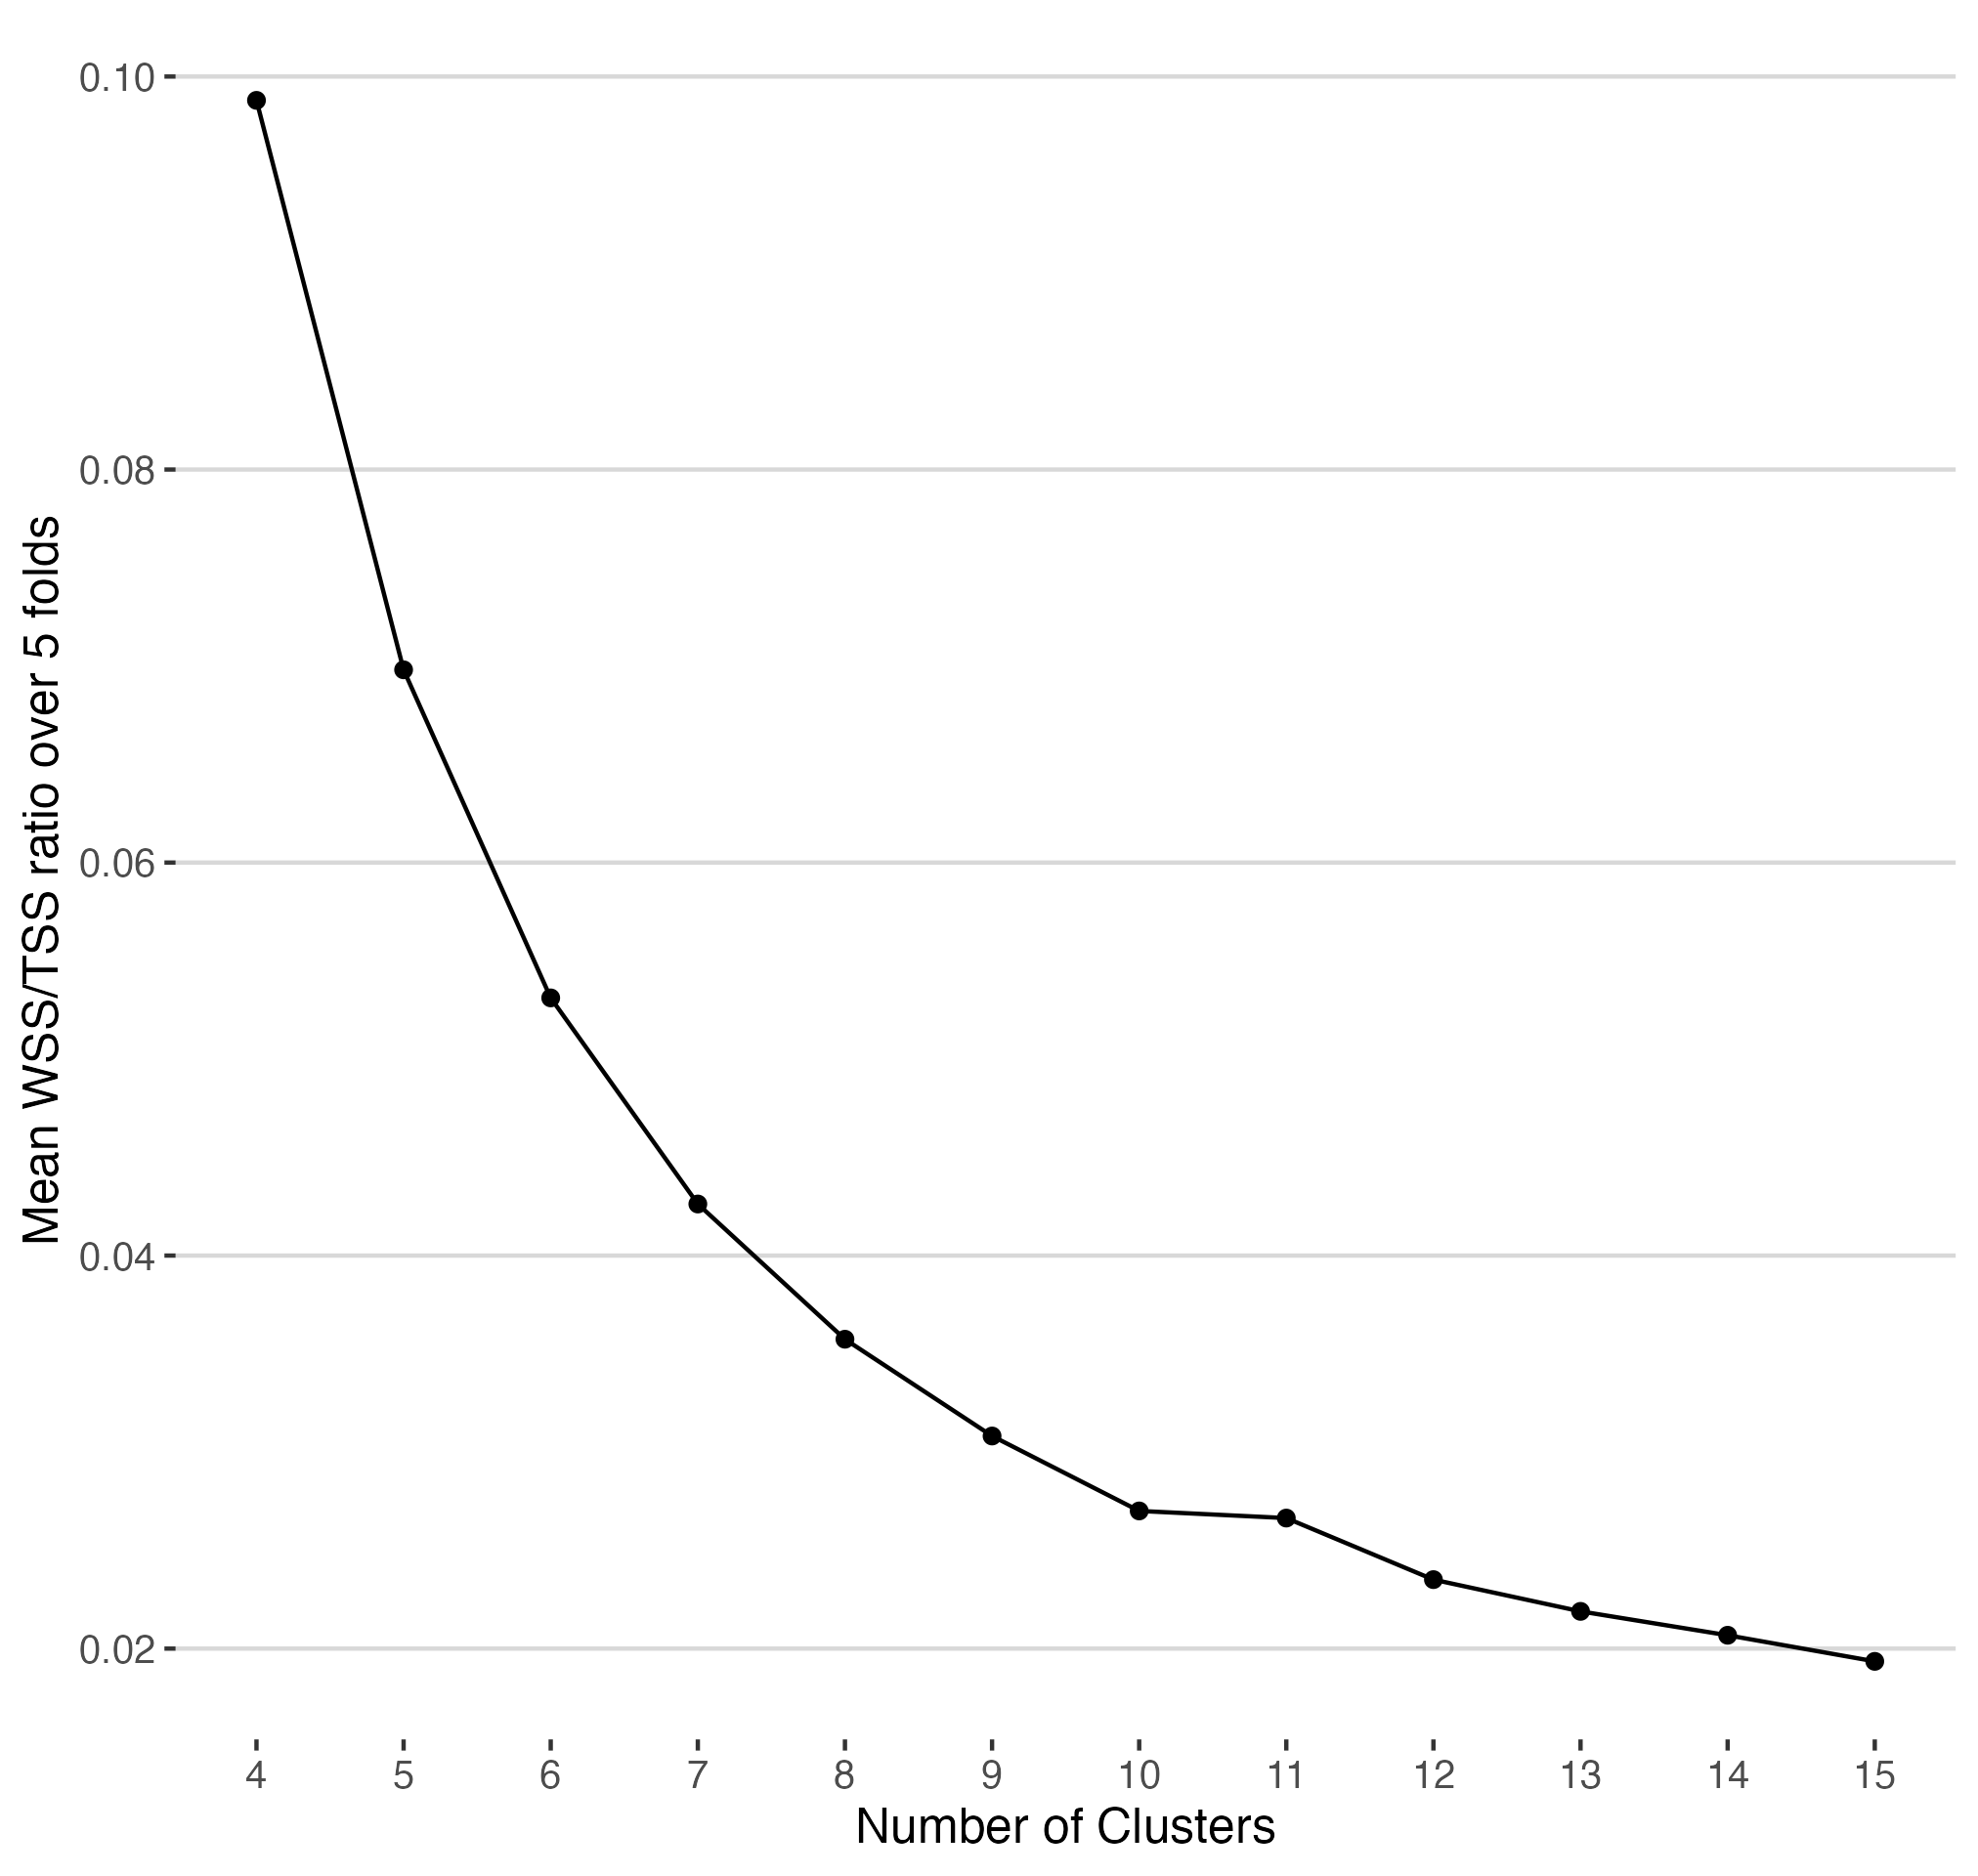
## How many clusters should I use? {.smaller}
:::: {.columns}
::: {.column width="55%"}
```{r clustering}
#| eval: false
#| echo: true
#| code-fold: false
#| code-overflow: scroll
#| code-line-numbers: 2|7-8|14
pitch.data.cv <- vfold_cv(pitch.data, v=5)
km.stats.spec <- k_means(mode="partition",engine="stats",num_clusters=tune())
pitch.data.recipe <- recipe(~ .,
data = pitch.data) |>
step_rm(pitcherId, pitchType, pitch, category)
km.workflow <- workflow(pitch.data.recipe, km.stats.spec)
cluster.grid <- grid_regular(num_clusters(range=c(4,15)),
levels=12)
km.results <- tune_cluster(
km.workflow,
resamples=pitch.data.cv,
grid=cluster.grid,
control=control_grid(save_pred=TRUE, extract=identity),
metrics=cluster_metric_set(sse_within_total, sse_total, sse_ratio)
)
km.performance <- km.results |> collect_metrics()
km.performance |>
filter(.metric=="sse_ratio") |>
ggplot(aes(x=num_clusters, y=mean)) +
geom_point() +
geom_line() +
ggthemes::theme_hc() +
labs(x="Number of Clusters",
y="Mean WSS/TSS ratio over 5 folds") +
scale_x_continuous(breaks=4:15)
```
:::
::: {.column width="45%"}
:::
::::
## Clustering pitches together {.smaller}
```{r kmeans}
#| eval: true
#| echo: true
#| code-fold: true
#| code-overflow: scroll
n_clusts <- 10
km.spec.n <- k_means(mode="partition", engine="stats", num_clusters = n_clusts)
km.fit <- km.spec.n |>
fit(~ . -pitcherId -pitchType -pitch -category, data=pitch.data)
km.fit |> tidy() |>
select(cluster, size, releaseVelocity, spinRate, spinDir, px, pz, x0, z0, vx0, vy0, vz0, ax, ay, az) |>
knitr::kable(digits=2,format.args = list(big.mark = ",",scientific = FALSE)) |>
kableExtra::kable_styling(latex_options = "scale_down")
```
```{r distances}
#| eval: true
#| echo: false
#| code-fold: true
#| code-overflow: scroll
dists <- Rfast::dista(km.fit |>
extract_centroids() |>
select(-.cluster),
pitch.data |> select(-pitcherId, -pitchType, -pitch, -category),
trans = FALSE) |>
as_tibble() |>
setNames(km.fit |>
extract_centroids() |>
select(.cluster) |>
mutate(.cluster=str_replace(.cluster,"_"," ")) |>
pull())
# dists <- dists |>
# rowwise() |>
# mutate(dist_from_centroid = min(c_across(starts_with("C"))))
dists$dist_from_centroid <- apply(dists,1,FUN=min)
dists$.cluster_pred <- extract_cluster_assignment(km.fit) |>
mutate(.cluster=str_replace(.cluster,"_"," "),
.cluster=factor(.cluster,levels=sapply(seq(1,n_clusts),\(x) paste("Cluster", x)))) |>
pull()
dists$pitchType <- factor(pitch.data$pitch, levels=c("Four Seamer","Two Seamer", "Cutter", "Sinker", "Fastball", "Curveball", "Slider", "Knuckle Curve", "Screwball", "Changeup", "Splitter", "Knuckleball", "Forkball", "Eephus", "Intentional Ball", "Pitchout", "Automatic Ball", "Unknown"))
dists$category <- factor(pitch.data$category,levels=c("Fastball","Breaking","Offspeed","Other"))
```
## How did the model perform? {.smaller}
```{r model_performance}
#| eval: true
#| echo: true
#| code-fold: true
#| code-overflow: scroll
#| fig-align: center
#| fig-height: 7
#| #| fig-width: 10
dists |>
group_by(category, pitchType,.cluster_pred) |>
count() |>
ggplot(aes(x=pitchType,
y=.cluster_pred,
fill=.cluster_pred,
alpha=n,
label=scales::label_number(accuracy=1,scale_cut = cut_short_scale())(n),
group=category)) +
geom_tile() +
geom_text(aes(color=ifelse(n<15000,"white","black"))) +
labs(x="Pitch Type",
y="") +
scale_fill_discrete(type="viridis") +
scale_x_discrete(limits=rev) +
scale_color_identity() +
facet_grid(category~., scales="free", switch="y", space="free_y") +
coord_flip() +
guides(fill="none",alpha="none") +
ggthemes::theme_hc() +
theme(strip.placement="outside",
strip.background = element_blank(),
panel.grid.major.y = element_blank())
```
## What about those pitches that don't really fit? {.smaller}
```{r}
#| label: outliers
#| eval: true
#| echo: true
#| code-fold: true
#| code-overflow: scroll
#| fig-align: center
#| fig-height: 7
outliers <- dists |>
group_by(.cluster_pred) |>
mutate(outlier = ifelse(dist_from_centroid > quantile(dist_from_centroid, 0.75)+1.5*IQR(dist_from_centroid),"#DC3220","#212529")) |>
mutate(outlier = ifelse(dist_from_centroid < quantile(dist_from_centroid, 0.25)-1.5*IQR(dist_from_centroid),"#DC3220",outlier))
outliers |>
ggplot(aes(x=.cluster_pred,y=dist_from_centroid)) +
geom_boxplot(outlier.shape=NA) +
geom_jitter(data=outliers |> filter(outlier=="#DC3220"), aes(color=outlier), width=.15, alpha=.1) +
labs(y="Distance from Centroid",
x="") +
scale_color_identity() +
guides(color="none") +
ggthemes::theme_hc()
```
## What do those outliers look like? {.smaller}
::: {.r-stack}
::: {.fragment}
```{r}
#| eval: true
#| echo: true
#| code-fold: true
#| code-overflow: scroll
#| fig-align: center
#| fig-height: 6
outliers |>
filter(.cluster_pred=="Cluster 1") |>
group_by(category,pitchType,outlier) |>
count() |> group_by(outlier) |>
mutate(pct=n/sum(n),
pct=ifelse(outlier=="#212529",-1*pct,pct)) |>
ggplot(aes(x=pitchType,y=pct,fill=outlier)) +
geom_col() +
facet_grid(category~., scales="free", switch="y", space="free_y") +
scale_y_continuous(breaks = c(-1,-.5,0,.5,1),
limits = c(-1,1),
labels=c("100%","50%","0%","50%","100%")) +
scale_fill_identity() +
coord_flip() +
labs(x="Pitch Type",
y="",
title="Proportion of Pitch Types assigned to Cluster 1") +
ggthemes::theme_hc() +
theme(strip.placement="outside",
strip.background = element_blank())
```
:::
::: {.fragment .fade-in-then-out}
```{r}
#| eval: true
#| echo: true
#| code-fold: true
#| code-overflow: scroll
#| fig-align: center
#| fig-height: 6
outliers |>
filter(.cluster_pred=="Cluster 5") |>
group_by(category,pitchType,outlier) |>
count() |> group_by(outlier) |>
mutate(pct=n/sum(n),
pct=ifelse(outlier=="#212529",-1*pct,pct)) |>
ggplot(aes(x=pitchType,y=pct,fill=outlier)) +
geom_col() +
facet_grid(category~., scales="free", switch="y", space="free_y") +
scale_y_continuous(breaks = c(-1,-.5,0,.5,1),
limits = c(-1,1),
labels=c("100%","50%","0%","50%","100%")) +
scale_fill_identity() +
coord_flip() +
labs(x="Pitch Type",
y="",
title="Proportion of Pitch Types assigned to Cluster 5") +
ggthemes::theme_hc() +
theme(strip.placement="outside",
strip.background = element_blank())
```
:::
::: {.fragment .fade-in-then-out}
```{r}
#| eval: true
#| echo: true
#| code-fold: true
#| code-overflow: scroll
#| fig-align: center
#| fig-height: 6
outliers |>
filter(.cluster_pred=="Cluster 10") |>
group_by(category,pitchType,outlier) |>
count() |> group_by(outlier) |>
mutate(pct=n/sum(n),
pct=ifelse(outlier=="#212529",-1*pct,pct)) |>
ggplot(aes(x=pitchType,y=pct,fill=outlier)) +
geom_col() +
facet_grid(category~., scales="free", switch="y", space="free_y") +
scale_y_continuous(breaks = c(-1,-.5,0,.5,1),
limits = c(-1,1),
labels=c("100%","50%","0%","50%","100%")) +
scale_fill_identity() +
coord_flip() +
labs(x="Pitch Type",
y="",
title="Proportion of Pitch Types assigned to Cluster 10") +
ggthemes::theme_hc() +
theme(strip.placement="outside",
strip.background = element_blank())
```
:::
:::
## Thank you
::: {id="credit"}
### Christopher Teixeira
[christopherteixeira.com](https://www.christopherteixeira.com)
:::
[{{< fa envelope size=xl >}} chris@christopherteixeira.com](mailto:chris@christopherteixeira.com)
[{{< fa brands linkedin size=xl >}} in/christopherteixeira](https://www.linkedin.com/in/christopherteixeira/)
[{{< fa brands github size=xl >}} ct-analytics](https://github.com/ct-analytics)